Publication date:
May 2022
OVERVIEW
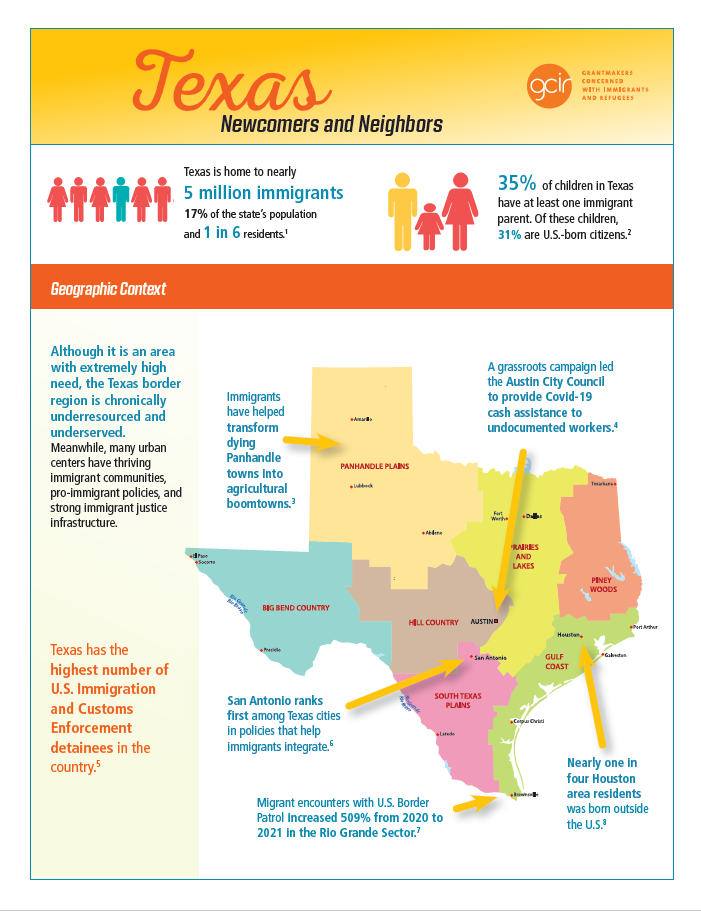
This two-page infographic looks at the foreign-born population in Texas, including legal status, regions of birth, geographic locations in the state, workforce and economic contributions, and other factors.
LEGAL STATUS OF texas' FOREIGN-BORN POPULATION
- Naturalized citizens: 38%
- Other Legal Status (including green cards & visa holders): 29%
- Undocumented: 33%
- Eligible to naturalize: nearly 1 million
- DACA recipients: 107,000
- Refugees resettled in Georgia (2010-2019): nearly 57,000
REGIONS OF BIRTH FOR texas' FOREIGN-BORN POPULATION
- Latin America: 66.1% (includes South America, Central America, Mexico, and the Carribean)
- Asia: 22.8%
- Africa: 5.9%
- Europe: 4%
- Northern America: 1.1% (Canada, Bermuda, Greenland, and St. Pierre and Miquelon)
- Oceania: 0.3%
WORKFORCE AND ECONOMIC CONTRIBUTIONS
Fiscal and economic impacts of Texas' immigrant-led households in 2019:
- $26.3 billion in federal taxes
- $12.3 billion in state and local taxes
- 23%: Immigrant share of the state's 2019 labor force
- 429,414 immigrant business owners accounted for 29% of all self-employed Georgia residents in 2018 and generated $10.8 billion in business income.
For more information, review the full infographic.
| Attachment | Size |
|---|---|
| 1.15 MB |